
Jed Michael, Global Affairs Officer
Under the assumption that reducing international poverty is an admirable policy goal worth some cost, defining and measuring – together operationalising – poverty becomes very important. But in discussions of reducing poverty, how we are actually measuring it is talked about relatively rarely. This begs the question of how sure we can be that we are actually making progress towards reducing and ultimately eradicating poverty.
Consider a common strategy of measuring poverty labelled the ‘headcount ratio’. Such a measure determines how many people are in poverty by asking the question ‘how many people earn an income below some threshold?’. This might feel very intuitive, but it has three major problems.
Firstly, the threshold varies across organisations. Whilst the first UN sustainable development goal seeks to eradicate extreme poverty for all people everywhere, currently measured as people living on less than $1.25 a day, the World Bank uses the international poverty line of $2.15 a day is used to track progress toward meeting the target of reducing the share of people living in extreme poverty to less than 3 percent by 2030. Whilst general income increases will reduce poverty on both metrics, redistributive policies become more complicated. Transfers from someone earning between $1.25 and $2.15 a day to someone earning <$1.25 a day would increase poverty according to the World Bank, but reduce it according to the UN. Given the central importance of redistribution as a poverty tackling strategy, this is a significant flaw.
Secondly, the measure is not consistent with the intuitive idea that poverty cannot be reduced through transfers from poorer to richer individuals – e.g. regressive taxation. Formally, this is known as lacking ‘distributional sensitivity’. This is a problem because, in theory at least, one way to ‘reduce’ poverty as measured by a headcount ratio is to redistribute from the most destitute in society to those just above the poverty line. Given the common lack of political power possessed by the poorest in society, this strategy might actually be the most politically expedient way to appear to be taking action against poverty. To demonstrate these first two problems, consider a three-person ‘mini’ economy pre- and post-redistribution. In this example, the ‘overall’ poverty score is simply the proportion of the population under the poverty line.
| Individual | Initial daily income | Transfer Strategy 1 | Final daily income 1 | Transfer Strategy 2 | Final daily income 2 |
| 1 | $2.14 | 0 | $2.14 | +$0.02 | $2.16 |
| 2 | $1.24 | +$0.02 | $1.26 | -$0.02 | $1.22 |
| 3 | $2.16 | -$0.02 | $2.14 | 0 | $2.16 |
| WB threshold score | 0.5 | 0.75 | 0.25 | ||
| UN threshold score | 0.25 | 0 | 0.25 |
In strategy 1, a small amount of redistribution causes the WB poverty score to increase (poverty worsens) whilst also causing the UN poverty to score to reduce (poverty is alleviated). In strategy 2, redistribution from the poorest member of society to the person in the middle results in the World Bank measure suggesting that poverty has decreased. Obviously, the numbers are highly contrived, but the mechanisms at work are entirely plausible.
Thirdly, there is increasing consensus that income alone is an insufficient proxy for what poverty actually is, even when adjusted for purchasing power. This is because even with this adjustment, the quality of life available to an individual with a certain income is highly context dependent. To provide just one example, a certain income in a country with effective public goods provision – healthcare, education – will correspond to a greater quality of life than in a country where these services are costly, or unavailable. We see this in data – Cuba has relatively modest income levels but boasts much more impressive outcomes in health and education. Poverty measures that only account for income cannot capture this.
One alternative approach to measuring poverty that addresses all three of these problems is ‘multidimensional poverty’. This approach conceptualises poverty as consisting of many different features, and in measurement takes into account the relative poverty of people differently below thresholds in income, nutrition, and education. The mathematics is relatively complicated (you can read an excellent explanation of it here), but it produces a single number that best matches out intuitions of what poverty is and how it changes.
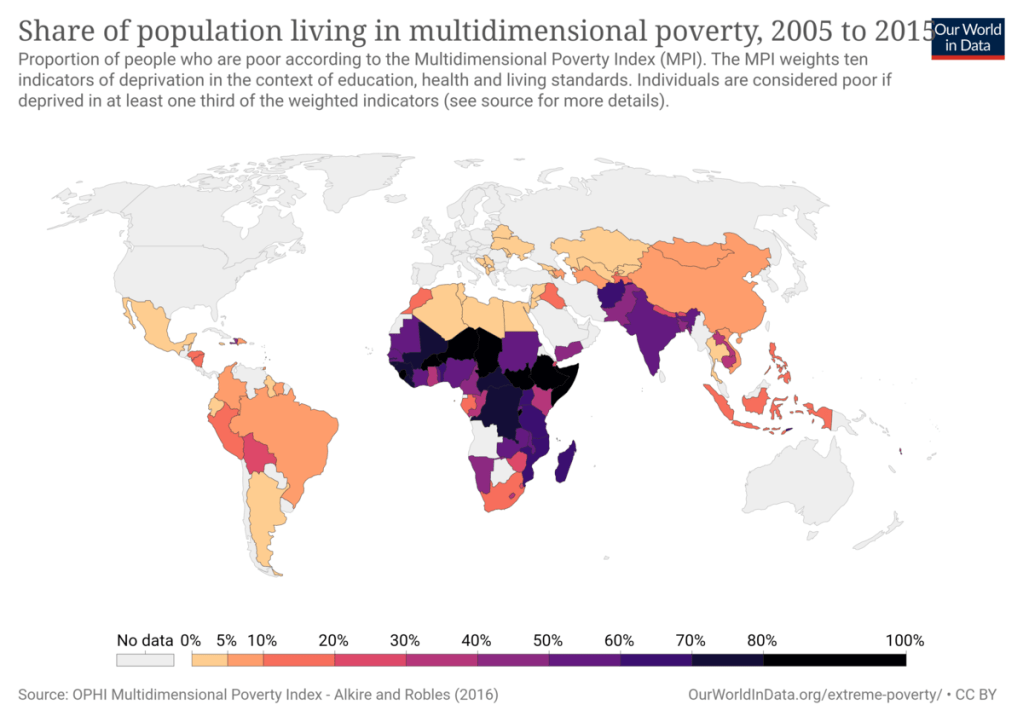
In their defence, the UN increasingly recognises the need for a better developed measure of poverty, and has called for updated multidimensional poverty data. The main constraint on our ability to measure poverty in the way described above is that it requires a lot of information and data that we currently do not collect. Much of the essential work in this area is actually being carried out here in Oxford via the Oxford Poverty and Human Development Initiative, which is involved in both accurately measuring multidimensional poverty and formulating policies to reduce it. This enables the production of graphics such as the one below, which estimates levels of multidimensional poverty in different countries.
Whilst the transition towards multidimensional poverty is very encouraging, it should be noted that the problems with headcount ratios examined above are not automatic – whilst the measures can be exploited, they also are relatively functional in the event that countries focus on increasing wealth generally rather than specifically reducing poverty according to the measures. Whilst we should develop better alternatives, we should also be encouraged by the fact that poverty according to headcount ratios is reducing – the chances are that this does represent genuine progress rather than merely gaming the system. It is just important that we are aware of the possibility, and are vigilant against attempts by countries to do so.
